
1.1 — Our understanding of the commission
- The reframe: WYCA is buying a repeatable learner-destinations system, connecting each learner's starting point and intent to what happens next, extendable with confidence to 45,000+ learners. Every design decision tested against two questions:
- Does it produce statistically robust intelligence on effectiveness and value for money?
- Would it still work, affordably, at three times the scale?
- Learner-outward design: recognises many of the 14,500 have Entry Level English/maths, are new English speakers, or work construction patterns that make daytime contact hard. Response:
- Three-minute instruments at Entry Level reading age
- Three simple answer scales, used consistently
- Personalised invitations auto-generated by email and/or SMS, timed to enrolment
- Telephone interviewing reserved for those the online channel won't reach
- Online surveys in other languages where required; telephone interpretation sourced where needed
- Matched pairs = the unit of value: the same learner at baseline and destination. The statistics and VfM analysis rest on matched-pair number and balance; funnel, quotas and reporting are all expressed in matched pairs; forecasts are conservative and evidenced, not optimistic.
- Data protection as architecture: identifiable data held and processed in one place only (IBP as named sub-processor); Thrive analyses pseudonymised extracts with no names or contact details; WYCA remains controller throughout, with visibility via the live dashboard.
- Insider knowledge: Thrive has already evaluated WYCA's Employment Hubs (all five districts), its ESOL and Essential Skills AEB provision, and Skills for Growth; and has worked with the providers who will supply the learner data.
1.2 — Our understanding of the context
- Skills profile: skills base trails national at both ends; ~90,000 employer skills gaps (highest of any Mayoral authority). The three provision types target this gap.
- Socio-economic: 2.4m people, five different district labour markets; these learners are disproportionately deprived, low-literacy or new English speakers, digitally excluded, and hard to reach.
- Priorities: the Local Growth Plan (£7bn) and the April 2026 Integrated Settlement (~£2bn/4yrs) bring a new outcomes framework demanding transparent measurement — this pilot builds that capability.
- Delivery landscape: WYCA's £65m annual Adult Skills Fund runs through three provider types, each a different data-collection reality.
How 1.2 affects design — the data providers
My reading of who supplies the learner data, by type, and what each implies for the build.
| Data provider | Data provider type |
|---|---|
| Leeds Adult Learning | LA adult learning service |
| Kirklees adult learning service | LA adult learning service |
| Bradford adult learning service | LA adult learning service |
| Calderdale adult learning service | LA adult learning service |
| Wakefield adult learning service | LA adult learning service |
| Leeds City College (Luminate group) | FE college |
| Keighley College (Luminate group) | FE college |
| University Centre Leeds (Luminate group) | FE college |
| Bradford College | FE college |
| Calderdale College | FE college |
| Kirklees College | FE college |
| Heart of Yorkshire group | FE college |
| Leeds College of Building | FE college |
| Maximus | Independent training provider (Adult Skills DPS) |
| Specialist local providers | Independent training provider (Adult Skills DPS) |
Design implications
- Heterogeneous data shapes and quality → a mandated intake template with automated validation (required fields, phone/email formats, de-duplication, provision codes) and named exception reports.
- Varying provider admin capacity → a deliberately minimal provider role, briefed at inception workshops and an onboarding surgery.
- No comparable single-provider tracking → a single survey system with unique-ID deterministic matching to produce comparable data across all providers.
- Learners recurring across providers and funding streams → de-duplication and consistent provision-code validation at intake.
1.3 — Our delivery model
Six defining features, each a deliberate methodological choice.
- Deterministic matching by unique learner ID — every invitation carries a personal link generated from the record, so baseline and outcome match reliably by unique learner ID — no manual linking, no fuzzy matching.
- A guaranteed matched sample — 350 quota-managed telephone interviews contractually underwrite the matched sample (extendable to 500 through the change process if online underperforms), deployed at the outcome stage where each call creates a pair.
- Data cleanliness at the point of entry — mandated intake template; provider files checked against agreed validation rules before any file enters the database; rejects returned on named exception reports; per-provider quality visible on the dashboard.
- Instruments designed backwards from the final report — the economist specifies the analysis needs; instruments informed by the London Learner Survey, then cut hard for this population.
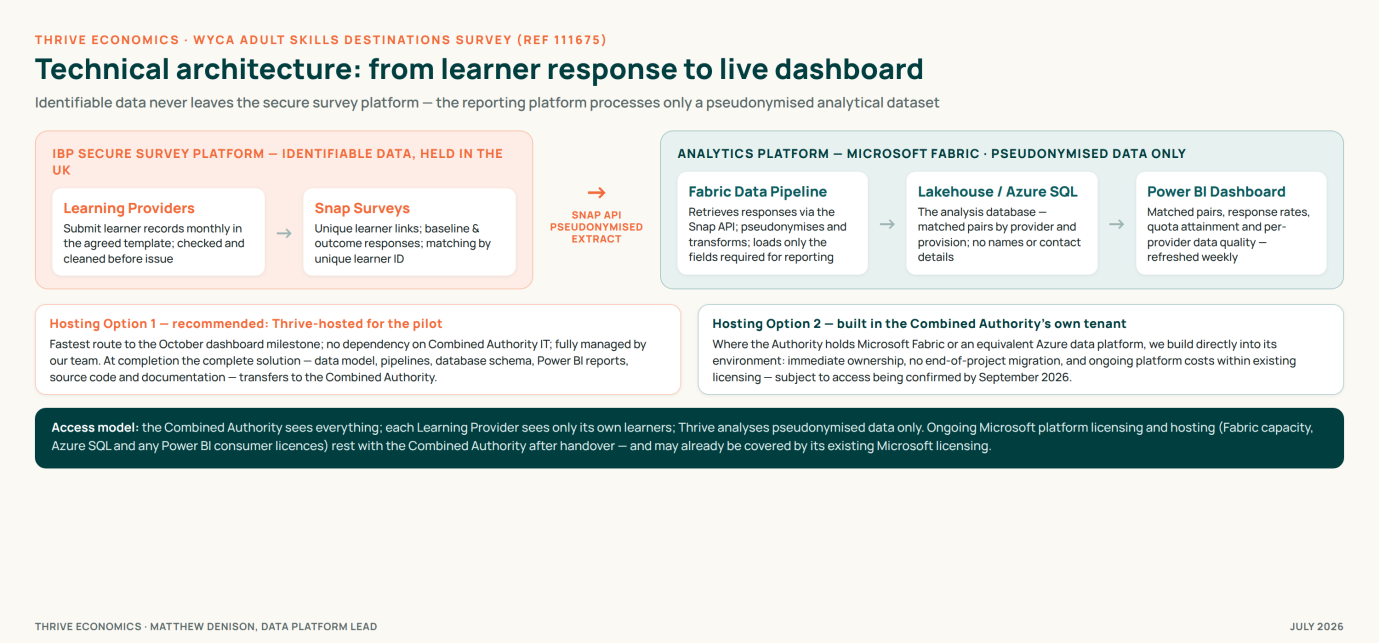
- Privacy by design, dashboard as the working heart — IBP holds all identifiable data in a single Snap database; a Microsoft Fabric pipeline retrieves responses via the Snap API, pseudonymises and transforms them, and loads only reporting fields into the analysis database; the Power BI dashboard reports directly from it.
- Tailor-made and WYCA-owned at the end — the complete solution (instruments, intake template, data model, integration pipelines, database schema, Power BI reports, source code and documentation) transfers to WYCA at completion, built on the Microsoft platform it already uses, with no proprietary fees and no vendor lock-in (transfer done at cost, open-book).
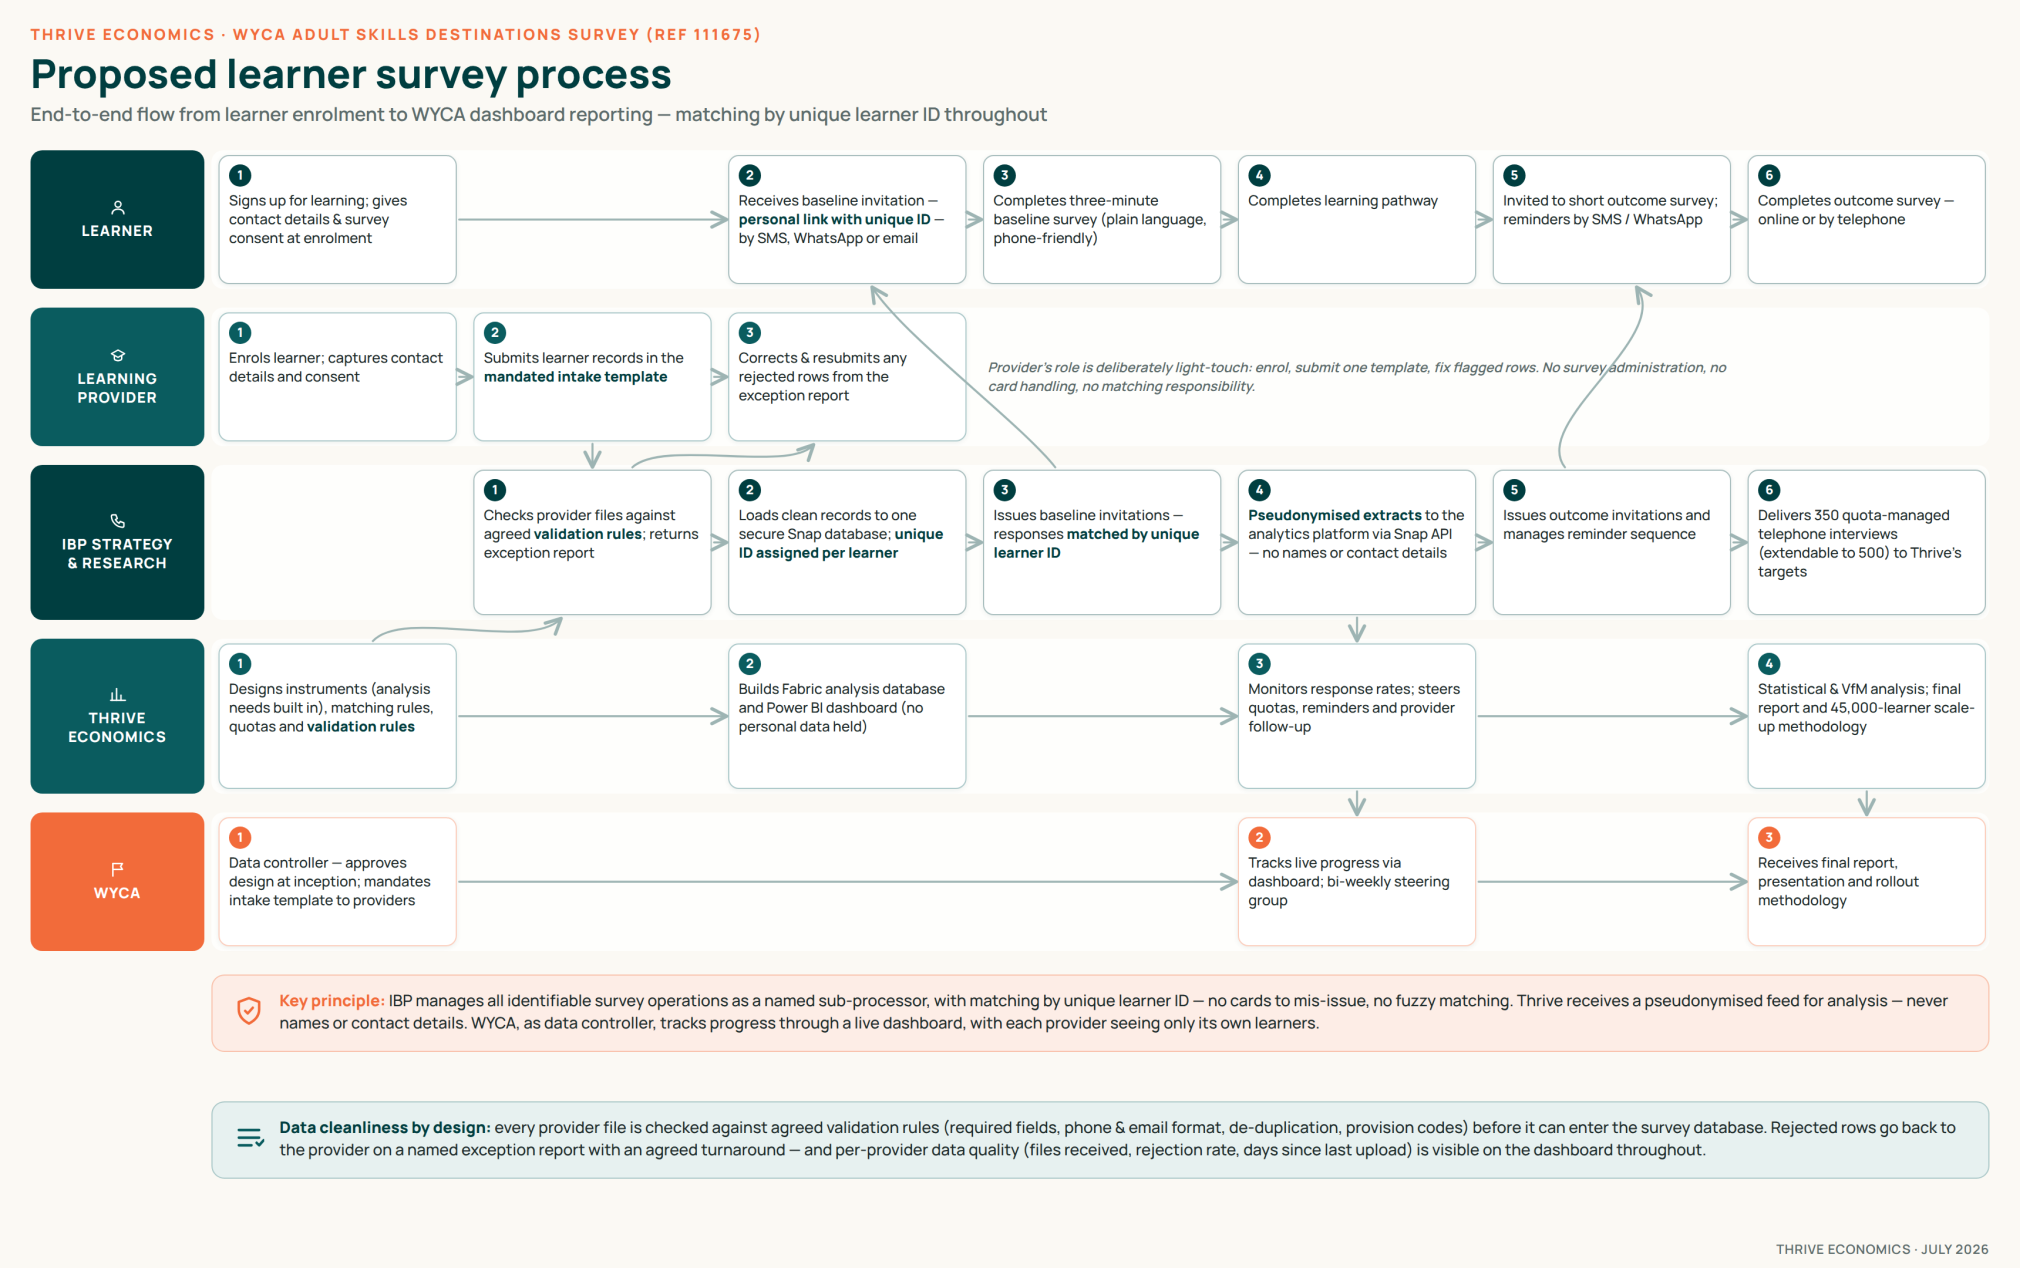
- Boundary / DPIA point: IBP's Snap platform holds the identifiable data; your pipeline pulls via the Snap API and pseudonymises, so you do handle identifiable data at the extraction/pseudonymisation step, and only pseudonymised fields land downstream. Note the submitted doc is inconsistent here — Figure 1 shows pseudonymisation on IBP's side, feature 5 puts it in your pipeline; worth pinning down exactly where it executes.
- Access model: WYCA sees everything; each provider sees only its own learners (two access tiers).
- Per-provider data-quality panel: files received, rejection rate, days since last upload.
- Core content: baseline/outcome response numbers, matched pairs by provider and provision, response-rate tracking (against the forecast targets in Figure 2).
- Role: WYCA's live progress tracker and the standing exhibit at the bi-weekly steering group — must be always-current, not batch-updated.
1.4 — Our work stages, deliverables and milestones
Seven stages, mapped to the SoR deliverables and published dates. Stages 3 and 5 (highlighted) are your dashboard scope.
| # | Stage (timing) | What happens | Deliverable / milestone |
|---|---|---|---|
| 1 | Inception & design lock (Aug–Sep 2026) | Inception meeting; delivery strategy + target respondent numbers agreed; instruments, sampling, quota and matching rules locked; DPIA support; provider engagement plan | Inception paper — Sept 2026 (30%) |
| 2 | Provider mobilisation & intake system (Sep–Oct 2026) | Intake template mandated by WYCA; data validation processes developed and tested with IBP; provider briefings; first files validated and loaded | All participating providers live |
| 3 | Survey build & data pipeline (Sep–Oct 2026) | Snap survey build with unique-ID links; Snap API extract pipeline, Fabric analysis database and Power BI dashboard built and tested against live test data | Dashboard operational — Oct 2026 (20%) |
| 4 | Rolling fieldwork (Oct 2026–Aug 2027) | Invitations auto-generated by email/SMS as validated records arrive; follow-ups issued automatically at set intervals; automated reminders (WhatsApp considered at mobilisation); channel success reviewed to inform rollout; 350 telephone interviews, steered monthly, extendable to 500 | Survey issuance across 11 months (Oct 2026–Aug 2027), within the 14-month window |
| 5 | Ongoing management & reporting (continuous) | Bi-weekly steering; live dashboard maintained; response-rate reports; per-provider data-quality monitoring and exception management; 3-working-day response | Bi-weekly steering; dashboard always current |
| 6 | Analysis (Jul–Sep 2027) | Full statistical analysis (SDs, standard errors, confidence levels) by provision and provider; effectiveness + VfM led by the economist, Green/Magenta Book | Analysis complete for reporting |
| 7 | Final report, presentation & scale-up (Sep 2027) | Final report + one-page graphical summary + executive summary; presentation; costed 45,000+ roll-out methodology | Final report — Sept 2027 (50%) |
1.5 — Sample size
The fieldwork funnel: conservative, evidenced forecasts. Matched pairs are the unit of value.
Based on the submission's Figure 2. Open original Figure 2 ↗
What 698 pairs can honestly support — tiered reporting
- Warehouse grain & dimensions: model to programme / provision (×3) / provider, plus channel (online vs telephone), monthly cohort, and the four outcome types. The matched pair is the core fact.
- Track actuals vs forecast: the dashboard's response-rate view is variance-to-target against these numbers (2,900 baseline; 348 + 350 = 698 pairs), by provision and provider.
- Minimum cell size of 30 is a build rule, not a footnote: a reusable measure that flags or suppresses cells below 30, so neither the dashboard nor the report ever shows a small number as if precise.
- Two reporting registers from one model: inferential at programme/provision (carry SD, standard error, confidence intervals) and descriptive at provider — the warehouse must hold, or let you compute, the statistics behind both.
- Quota attainment: the 350 telephone pairs (extendable to 500) are steered to targets across provision, provider and demographics — hold the channel and quota dimensions so the dashboard can show attainment vs plan.
1.6 — Compatibility with the brief
A point-for-point compliance mapping to the Statement of Requirements.
- Both surveys, whole base — baseline + destination issued to as many of the 14,500 as possible; outcome stage uses automated SMS/email reminders plus telephone for demographic spread.
- All four outcome types measured — plain-language scales, with the option to anchor to ONS4 wording in telephone mode for national benchmarking.
- Fourteen-month management — automated baseline issuance as records arrive, outcome waves at set intervals; dashboard, response-rate reports, exception management and bi-weekly steering as specified.
- Every deliverable on the published dates — inception paper (Sept 2026), dashboard (Oct 2026), final report with one-page graphical summary and executive summary (Sept 2027), rollout methodology for 45,000+.
- Data protection met structurally — WYCA controller; IBP sub-processor holding all identifiable data in the UK; DPIA pre-award; full compliance with the security standards.
1.7 — Our experience of similar projects
Each defining feature traces to something learned on similar work.
| What experience taught us | How it shaped the methodology |
|---|---|
| Skills evaluation for WYCA (ESOL, Essential Skills; the providers and learner journeys first-hand) | Realistic assumptions about provider capacity and contactability; a genuinely light-touch provider role; instruments that reflect how these courses run. |
| Whole-base learner surveys returned single-digit response; telephone pilots roughly doubled it | A defensible conservative 20% baseline forecast; multi-channel invitations timed to enrolment; telephone capacity deployed where it creates matched pairs. |
| Fieldwork with low-literacy and ESOL learners: long instruments and numeric scales suppress response | Three-minute surveys at Entry Level reading age; three consistent answer scales; no numeric scales; translated online surveys where required. |
| IBP's survey operations (telephone fieldwork, Snap management) | Quota-managed interviewing steered monthly; a single secure identifiable-data environment; professionally managed reminder and exception processes. |
| Multi-provider data collection: inconsistent submission is the main cause of delay and quality failure; manual cleaning does not scale | Mandated intake template, automated validation with exception reports, and per-provider data quality on the dashboard. |
| Green Book and Magenta Book practice (HM Treasury appraisal / evaluation) | An analysis plan specified before fieldwork; instruments designed backwards from the effectiveness / VfM analysis; uncertainty reported honestly. |
1.8 — What WYCA owns when the commission ends
- Documented handover pack at completion — tested survey instruments, provider intake template and guidance, validation processes, matching rules, data model, integration pipelines, database schema, Power BI reports and source code — everything needed to run the system again, owned outright.
- Ongoing licensing / hosting passes to WYCA — Fabric capacity, Azure SQL and any Power BI consumer licences; may already be covered by WYCA's existing Microsoft licensing.
- Rollout methodology presents costed in-house-vs-commission options, so WYCA chooses its operating model from ownership, not vendor dependency.
1.9 — Assumptions and managed dependencies
Three dependencies, each a managed dependency with a fallback, not a condition of delivery.
- Learner contact details & consent captured by providers in the agreed template; WYCA mandates it and owns provider compliance; Thrive monitors, reports and escalates, with per-provider data quality on the dashboard.
- VfM cost data supplied by WYCA at provision-type level (the economist's dependency, not yours).
- Analytics platform hosting (Microsoft Fabric, Azure SQL, Power BI) — Thrive-hosted by default, with deployment inside WYCA's own Microsoft tenant as an alternative where platform access is confirmed by September 2026.
2.1 — Our team
A six-person team; every SoR requirement has a named owner; the personal-data boundary runs cleanly between roles.
| Person | Commission role | Focus |
|---|---|---|
| Chris Maunder (Co-Director, Thrive) | Commission Director | Single point of contact; methodology; analysis oversight; final report author |
| Sam Maunder (Research Consultant, Thrive) | Research Consultant | Response monitoring; data-quality management; statistical analysis; reporting |
| Dom Chapman (Co-Director, Thrive) | Economic Modelling | Effectiveness & VfM analysis; survey-design input |
| Eddy Graham (Director, IBP) | Survey Operations Lead (named sub-processor) | Research design + fieldwork QA; all identifiable data; 350 telephone interviews |
| Fraser Gilfillan (Consultant, IBP) | Survey Manager | Day-to-day survey ops (Snap set-up, issuance, response monitoring); data processing; collation into matched dataset |
| Matthew Denison (Associate, Thrive) | Data Platform Lead | Snap API integration; Fabric pipelines; pseudonymisation; analytical database; Power BI dashboards |
2.2 (how the team fits together) is team-glue with no design impact — omitted.
2.3 — Technical resources
- Fieldwork on Snap Surveys (IBP's platform, secure UK environment) — where all identifiable data is held.
- Analysis runs on a scripted, version-controlled stack against the pseudonymised database.
- Live dashboard purpose-built for the commission, named-user access for WYCA and providers; transfers to WYCA at completion, with ongoing Microsoft licensing / hosting then resting with WYCA.
- Hosting engineered for economy: the ETL workspace runs on Fabric F2 pay-as-you-go capacity, auto-resumed for the nightly refresh and paused after; reporting sits on shared Power BI capacity using an import model, so dashboards stay available all day while Fabric is paused. Cost driven from ~£200/mo to ~£10–12/mo — the same discipline for the 45,000-learner rollout.
Q3 (Timescales) and 2.4 (case studies) omitted — nothing design-relevant. The Quality Control points that land on your platform:
- Data quality at point of entry — every provider file checked against agreed validation rules (required fields, contact formats, de-duplication, provision codes) before it enters the database; rejects returned on a named exception report.
- Deterministic matching by unique ID — removes manual linking, the largest error source in matched-pair designs.
- Tested launch — the end-to-end pipeline (intake → validation → Snap → Snap API → Fabric pipeline → analysis database → dashboard) is piloted with early providers before full rollout, so the October dashboard milestone is met with a system that has already run live data.
- Reproducible, version-controlled work — scripted and version-controlled against locked datasets; every figure traceable to code and data.
- Honest statistics in the model — tiered framework with a minimum cell size of 30 (flag or suppress below 30, never show a small number as precise).
- Dashboard as the monitoring vehicle — live dashboard + monthly response-rate report; a data-quality panel (files received, rejection rate, days since last upload) plus an exception log.
- Refresh commitment — dashboard data refreshed at least weekly (your nightly refresh exceeds this).
- Data subject rights & security — a learner who withdraws is removed from all contact within one working day; data encrypted in transit and at rest, held in the UK, destroyed at contract end with certified deletion.
Source: _context\Tender Submission\Data Destination Response, Thrive Economics.docx and Data Destination Workplan, Thrive Economics.docx